

DiscountAgent.com Blog • Seller Education
By Aaron Peters • Associate Broker/Owner, DiscountAgent.com • September 2026
Source: Wasatch Front Regional MLS, 80 months of closed sales, January 2020 – August 2026 • 11 min read
The Short Answer
List between mid-March and early May. But the spring advantage is smaller than it used to be.
Across the four most recent full or partial years, Salt Lake County single-family homes that closed in May and June spent a median of 18 to 20 days on market, versus 47 days for January closings. That pattern has held every year since 2023. What has changed is the margin: the fastest spring month has slowed from 13 days in 2023 to 25 days in 2026, while winter has barely moved.
Every real estate article tells you spring is the best time to sell. Almost none of them show you the numbers, and none that I could find show what has happened to those numbers over time.
So I pulled 80 consecutive months of closed single-family sales from the Wasatch Front Regional MLS for Salt Lake County — every month from January 2020 through August 2026 — and looked at one figure: median days on market. The seasonal pattern is real. But the more useful finding is how that pattern has shifted since the pandemic market ended, and what it means if you are deciding when to list this year.
The dataset covers Utah’s largest county, where roughly 600 to 900 single-family homes close in a typical month.
Seven Years of Salt Lake County Days on Market
Each cell is the median days on market for single-family homes that closed in that month. Teal is fast; red is slow.
| Year | Jan | Feb | Mar | Apr | May | Jun | Jul | Aug | Sep | Oct | Nov | Dec |
|---|---|---|---|---|---|---|---|---|---|---|---|---|
| 2020 | 38 | 29 | 12 | 8 | 16 | 16 | 12 | 8 | 8 | 8 | 8 | 8 |
| 2021 | 9 | 5 | 5 | 5 | 5 | 5 | 6 | 7 | 9 | 9 | 11 | 9 |
| 2022 | 12 | 5 | 5 | 5 | 6 | 8 | 14 | 24 | 28 | 34 | 33 | 41 |
| 2023 | 53 | 45 | 30 | 19 | 13 | 13 | 18 | 21 | 25 | 29 | 32 | 36 |
| 2024 | 45 | 36 | 26 | 20 | 13 | 19 | 24 | 30 | 30 | 32 | 34 | 42 |
| 2025 | 43 | 48 | 27 | 28 | 22 | 21 | 32 | 35 | 40 | 35 | 39 | 46 |
| 2026 | 48 | 49 | 32 | 26 | 25 | 26 | 31 | 39 | — | — | — | — |
Salt Lake County single-family, median days on market by month of closing. Source: Wasatch Front Regional MLS, pulled September 21, 2026. September 2026 excluded as a partial month.
What a Normal Year Looks Like
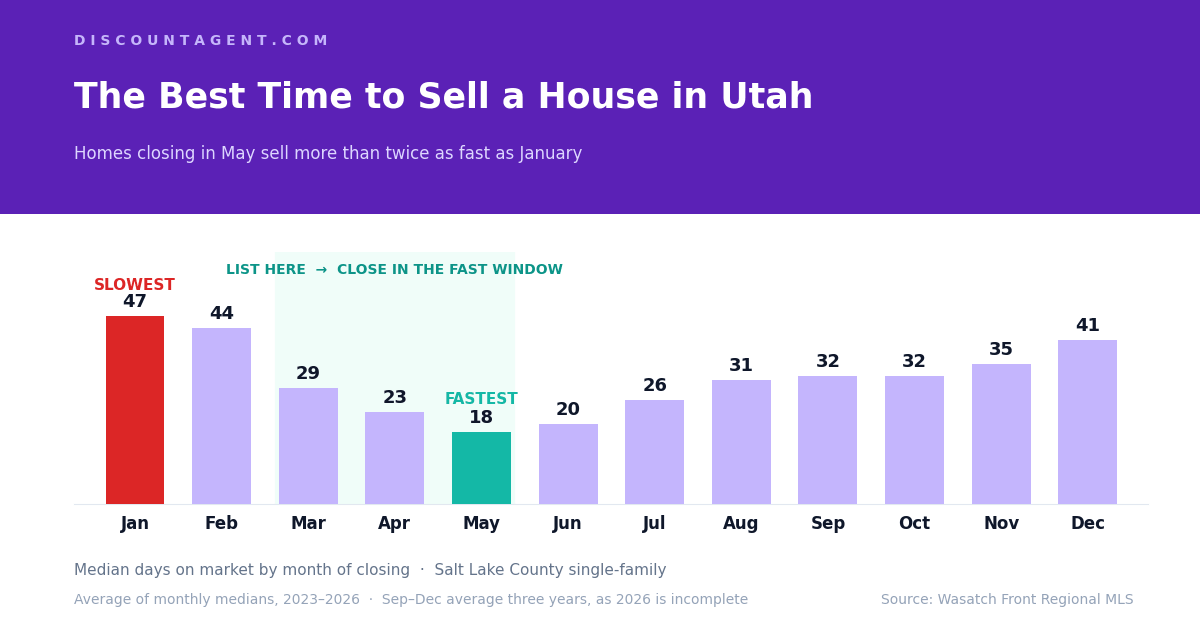
The 2020 through 2022 market was anything but normal, so the cleanest picture of a typical year comes from 2023 onward. Averaging each month across 2023 through 2026:
Average of monthly medians, 2023–2026. September through December average three years, since 2026 is not yet complete.
The curve is clean. Days on market fall steadily from January’s peak of about 47 days to a floor in May, near 18 days, then climb back through summer and fall. A home closing in May has typically spent well under half as long on the market as one closing in January.
List in March or April, Not May
Here is the detail most “best time to sell” articles get wrong. These figures are grouped by the month a home closed, and the days-on-market clock stops at contract, not at closing. You can see that in the data itself: in 2021, homes posted a median of 5 days on market, which would be impossible if the clock ran through a typical financed closing.
Closings generally follow the contract by about a month. So the homes that closed in May, having spent roughly 18 days on market, were mostly listed in late March and April and went under contract in April. If you want your home to be one of the fast May and June sales, the time to list is mid-March through early May — not May itself.
Working backward from a spring closing: list in late March or April → typically under contract within a few weeks → close in May or June. Listing in late May or June still works, but you are entering as the fast window closes, and July through December closings have run progressively slower in every recent year.
The Finding: Spring’s Advantage Has Shrunk
Spring has been the fastest season in every year since 2023. What has changed is how much faster.
| Year | Fastest Spring Month | Jan–Feb Average | Winter vs. Spring |
|---|---|---|---|
| 2023 | 13 days | 49 days | 3.8× |
| 2024 | 13 days | 40 days | 3.1× |
| 2025 | 21 days | 46 days | 2.2× |
| 2026 | 25 days | 48 days | 1.9× |
Fastest of April, May, and June closings each year. Median days on market, Salt Lake County single-family.
In 2023, a January closing took about three times as long as the fastest spring month. By 2025 and 2026, that gap had narrowed to under two times. Winter did not get faster — it held in the mid-40s. Spring got slower, nearly doubling from 13 days to 25.
The practical meaning: spring still gives you the most buyer activity and the quickest sales of the year, but it is no longer the kind of market that absorbs an ambitious list price in two weeks. In 2023 and 2024, a well-presented home in May could be under contract before the first weekend of showings was over. In 2026, the typical spring sale took closer to four weeks. Pricing matters more in spring now than it did three years ago, not less.
Why Did Spring Slow Down?
A slower spring usually means buyers have more homes to choose from and more room to negotiate. That is a market-conditions question, not a calendar one.
Is Salt Lake County in a Buyer’s Market or a Seller’s Market? →
When Timing Barely Matters — and When It Flips Mid-Year
Two years in the dataset are worth understanding, because they show that seasonality is a feature of balanced markets, not a law of nature.
2021: Seasonality Disappeared
The fastest month was 5 days and the slowest was 11. February performed identically to May. In a market that hot, when you listed barely mattered — everything sold, and usually above asking.
2022: The Market Turned Mid-Year
Homes closing from February through April posted 5 days on market. By December, the figure was 41. The same calendar year contained the fastest and among the slowest conditions in the dataset, as rising mortgage rates arrived over the summer.
The lesson for a seller today: the calendar is a strong default, but the market regime can override it. If conditions shift sharply — in either direction — the seasonal curve bends with them. This is also why it helps to know whether the county is currently a buyer’s or seller’s market before you pick a listing date.
Does Timing Affect Price, or Just Speed?
Speed is the clearer signal, but the data suggests price follows. The MLS tracks median sold price as a percentage of original list price — which captures any price reductions along the way. Comparing April through June closings with January and February closings:
2023
+3.3 pts
spring over winter
2024
+2.2 pts
spring over winter
2025
+0.7 pts
spring over winter
2026
+2.8 pts
spring over winter
On average, spring closings came in about 2 points closer to their original asking price. On a median-priced Salt Lake County home — roughly $640,000 in mid-2026 — that gap is worth approximately $14,000.
Read that number carefully. It is an association, not a guaranteed spring premium. Winter closings include a disproportionate share of listings that sat through the fall and took price reductions, which pulls the winter ratio down. The honest takeaway is less “spring pays you $14,000” and more “a listing that goes stale pays for it” — and stale listings are more common in the slow season.
If You Have to Sell in Winter
Plenty of sellers do not get to choose — job transfers, estates, divorces, and new-build closing dates do not wait for April. Winter selling is slower, not broken. Roughly 500 to 700 Salt Lake County single-family homes still closed in each recent January and February.
What changes is the margin for error. With median days on market in the mid-40s and sale-to-list ratios running lower, a winter listing should be priced to the current comps from the first day rather than tested high. The first two weeks carry the most buyer attention a listing will ever get; in winter there are fewer buyers to waste them on.
Timing is one lever. The commission you pay is another, and it is the one you control in every month of the year. On a $640,000 home, a 1.5% listing commission instead of the traditional 3% leaves approximately $9,600 more in your pocket — or more when the rate drops to 1% when you find your own buyer. See how the listing service works.
FAQ: When to Sell in Utah
Methodology & Disclaimer
Data: Wasatch Front Regional MLS Sales Per Month Report, Salt Lake County single-family, January 2020 through August 2026, pulled September 21, 2026. Figures are the median days on market for homes that closed in each month. The report includes only listings with list prices between $15,000 and $10,000,000 where sold price was within 25% of list. September 2026 is excluded as a partial month. MLS figures revise as late closings report. Price-gap figures are associations across different sets of homes, not causal estimates. Past patterns do not guarantee future results.
DiscountAgent.com is not a real estate brokerage. It is the marketing website of Aaron Peters, a licensed Utah real estate agent. Services are provided through NetLogix Realty, License #6390407-AB00. Commission rates are negotiable and are not set by law. Utah is a non-disclosure state; dollar figures shown are approximate.
Planning Your Listing Date?
Get a free market analysis built from recent sales in your neighborhood, plus a straight answer on when to list. Full-service listing at 1% to 1.5%. Five-Star Rated on Google since 2006.
Related Reading
Is Salt Lake County in a Buyer’s Market or a Seller’s Market? — Where conditions stand right now.
Salt Lake County Market Report 2026 — Current medians, sales, and sale-to-list ratios.
Salt Lake County Market Report 2024 — Full-year data with a days-on-market breakdown by property type.
Locked Into a Low Mortgage Rate? — The actual math on whether you can afford to move.
Enjoy this blog post? Click here to subscribe for updates
Leave A Comment