

DiscountAgent.com Blog • Seller Education
By Aaron Peters • Associate Broker/Owner, DiscountAgent.com • October 2026
Source: Wasatch Front Regional MLS, 1,885 single-family and 536 condo closings in Salt Lake City, October 2025 – September 2026 • Updated quarterly
The Short Answer
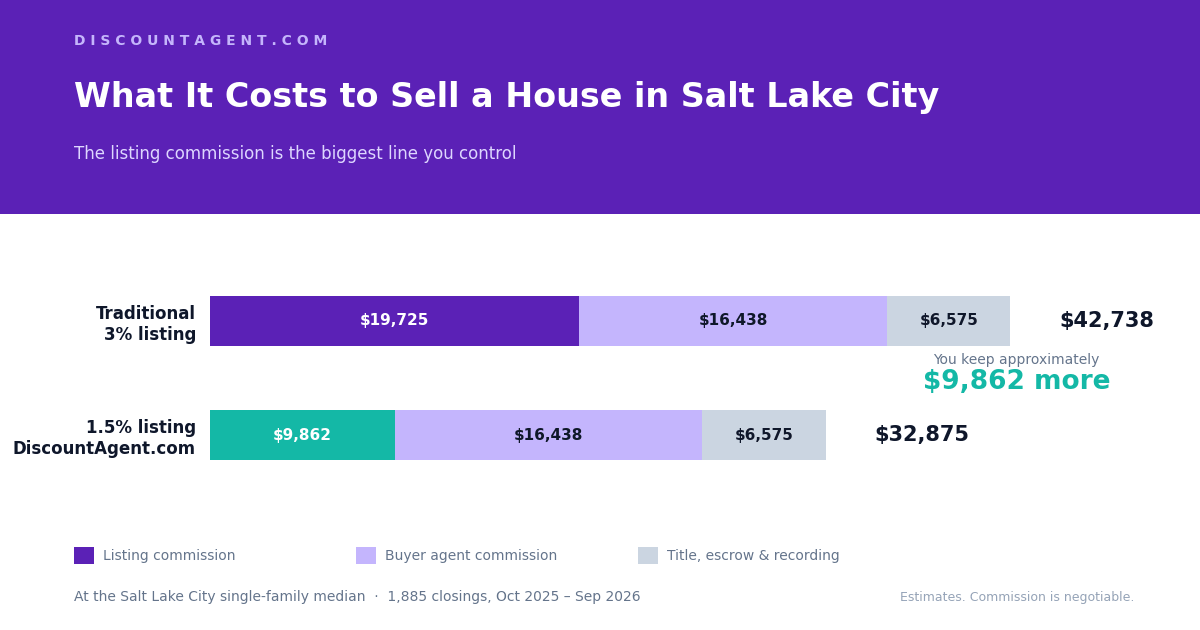
About $42,700 on a typical Salt Lake City house with a traditional agent, or roughly $32,900 with a 1.5% listing.
For a typical condo it is about $24,300 versus $18,700. But Salt Lake City is really two markets: houses here sold at or above asking price through spring, while condos took far longer and sold well below their original list price. Which one you own changes what you should worry about.
Salt Lake City has the busiest single-family market of any city in the county. Over the twelve months through September 2026, 1,885 single-family homes and 536 condos closed within city limits — about $1.8 billion in combined volume.
Houses here are smaller and pricier per foot than in the suburbs. The typical single-family home was about 2,000 square feet at roughly $337 per square foot, compared with about $222 in West Jordan. The average sold price, about $816,000, ran about 24% above the median, a sign of how wide the range is between neighborhoods. Every figure below comes from the Wasatch Front Regional MLS and is refreshed quarterly. For how Salt Lake City compares with the rest of the state, see current Utah home prices.
Salt Lake City Market Snapshot
Single-family homes
Closed sales
1,885
October 2025 – September 2026
Median sold price
~$658K
median of monthly medians
Median days on market
~30
fastest 15 in May
Sale to original list
98%
monthly range 95–101%
Median price per sq ft
$337
monthly range $305–$378
Average sold price
~$816K
pooled across all sales
| Month | Sales | Median Sold | Sale to List | $/Sq Ft | Days on Market |
|---|---|---|---|---|---|
| Oct 2025 | 169 | $615K | 95% | $331 | 31 |
| Nov 2025 | 124 | $639K | 99% | $330 | 36 |
| Dec 2025 | 143 | $595K | 95% | $305 | 47 |
| Jan 2026 | 110 | $655K | 95% | $319 | 59 |
| Feb 2026 | 122 | $616K | 99% | $337 | 43 |
| Mar 2026 | 162 | $660K | 99% | $337 | 25 |
| Apr 2026 | 201 | $680K | 100% | $348 | 18 |
| May 2026 | 204 | $666K | 101% | $365 | 15 |
| Jun 2026 | 227 | $685K | 98% | $345 | 21 |
| Jul 2026 | 167 | $735K | 95% | $378 | 28 |
| Aug 2026 | 119 | $587K | 98% | $338 | 34 |
| Sep 2026 | 137 | $680K | 97% | $354 | 28 |
Condos
Closed sales
536
October 2025 – September 2026
Median sold price
~$374K
median of monthly medians
Median days on market
49
fastest 32 in June
Sale to original list
~95%
monthly range 88–100%
Median price per sq ft
$346
monthly range $313–$372
Typical size
~1,080 sq ft
2 bed, 2 bath
| Month | Sales | Median Sold | Sale to List | $/Sq Ft | Days on Market |
|---|---|---|---|---|---|
| Oct 2025 | 39 | $367K | 95% | $336 | 51 |
| Nov 2025 | 32 | $390K | 91% | $342 | 45 |
| Dec 2025 | 46 | $385K | 95% | $313 | 70 |
| Jan 2026 | 24 | $365K | 90% | $356 | 61 |
| Feb 2026 | 38 | $350K | 88% | $334 | 60 |
| Mar 2026 | 58 | $422K | 94% | $371 | 33 |
| Apr 2026 | 49 | $369K | 95% | $361 | 33 |
| May 2026 | 65 | $373K | 93% | $372 | 48 |
| Jun 2026 | 60 | $364K | 99% | $334 | 32 |
| Jul 2026 | 49 | $375K | 100% | $348 | 50 |
| Aug 2026 | 34 | $380K | 97% | $345 | 58 |
| Sep 2026 | 42 | $409K | 93% | $365 | 46 |
Wasatch Front Regional MLS, Salt Lake County, City of Salt Lake City, pulled October 2, 2026. Monthly medians shown rounded. Sale to list compares sold price with original list price. October 2026 excluded as a partial month. September 2026 was pulled two days after month end and may rise slightly as late closings report.
The Full Cost Breakdown
Selling a house
| Cost | Traditional | DiscountAgent.com | Notes |
|---|---|---|---|
| Listing commission | 3% | 1% – 1.5% | The half you control. |
| Buyer agent commission | 2% – 3% | 2% – 3% | Negotiable since 2024, but most Salt Lake City sellers still offer it. |
| Title, escrow and recording | ~1% | ~1% | Owner’s title policy, settlement fee, recording. Utah has no state transfer tax. |
| Prorated property taxes | Varies | Varies | Your share of the year to closing. |
| Seller concessions | $0 – 3% | $0 – 3% | Only if negotiated. Less common in spring, when houses here sold at or above asking. |
Traditional Total
~6.5%
approximately $42,700 at the Salt Lake City house median
With a 1.5% Listing
~5%
approximately $32,900 — you keep about $9,900 more
Selling a condo
| Cost | Traditional | DiscountAgent.com | Notes |
|---|---|---|---|
| Listing commission | 3% | 1% – 1.5% | The half you control. |
| Buyer agent commission | 2% – 3% | 2% – 3% | Negotiable since 2024, but most Salt Lake City sellers still offer it. |
| Title, escrow and recording | ~1% | ~1% | Owner’s title policy, settlement fee, recording. Utah has no state transfer tax. |
| Prorated property taxes | Varies | Varies | Your share of the year to closing. |
| HOA transfer and payoff documents | Varies | Varies | Set by the association. Who pays is negotiated in the contract. |
| Concessions and price reductions | Varies | Varies | The real condo cost. See the next section. |
Traditional Total
~6.5%
approximately $24,300 at the Salt Lake City condo median
With a 1.5% Listing
~5%
approximately $18,700 — you keep about $5,600 more
Excludes prorated taxes, HOA documents, and negotiated concessions, which vary by property and closing date.
One City, Two Very Different Markets
This is what sets Salt Lake City apart from the suburbs, and it should shape how you price.
Houses: At or Above Asking
The median house sold for 98% of its original list price over the year. April and May closings came in at 100% and 101% — above asking — and May homes went under contract in a median of 15 days. Even the slowest month, January, held at 95%.
Condos: Slower and Below Asking
The median condo sold for about 95% of its original list price and spent 49 days on market — more than half again as long as a house. February closings came in at 88% of original list after a median of 60 days. December took 70.
On a typical condo, the gap between 95% and full asking price is about $19,000 — more than three times what a 1.5% listing saves you on commission. Condo buyers here have choices and time, and listings priced for negotiating room tend to sit, then sell for less. Pricing from your own building’s recent sales, rather than citywide figures, is where most of that money is. Salt Lake City condo buildings and listings.
For houses the risk runs the other way. In a spring market where homes sell above asking within a couple of weeks, an underpriced listing leaves money on the table just as surely as an overpriced condo does. See whether the county is currently a buyer’s or seller’s market.
The One Cost You Negotiate Up Front
Title fees are set by the title company, taxes by the county, and HOA fees by the association. The listing commission is the only major line where you choose the number before the home is listed.
| Sale Price | 3% Traditional | 1.5% Listing | You Keep | At 1% |
|---|---|---|---|---|
| $360,000 Typical condo | $10,800 | $5,400 | $5,400 | $7,200 |
| $500,000 | $15,000 | $7,500 | $7,500 | $10,000 |
| $650,000 Typical house | $19,500 | $9,750 | $9,750 | $13,000 |
| $800,000 | $24,000 | $12,000 | $12,000 | $16,000 |
| $1,000,000 | $30,000 | $15,000 | $15,000 | $20,000 |
Listing side only. Buyer agent commission is separate and negotiated per transaction. Commission rates are negotiable and are not set by law.
The rate depends on how the buyer arrives: approximately 1.5% when a cooperating broker brings the buyer, 2% if we find an unrepresented buyer, and just 1% when you find your own buyer — common in condo buildings, where a neighbor or a renter in the building is sometimes the buyer. Full service applies at every tier. See how the listing service works.
When Salt Lake City Homes Sell Fastest
Houses followed the countywide pattern closely: 15 days for May closings, 18 for April, and 59 for January. Condos moved on a flatter, slower curve — their fastest months, March, April, and June, still took 32 to 33 days.
Because days on market runs from listing to contract and closing follows about a month later, the fast spring closings came from listings that went live in March and April. For condos the seasonal edge is smaller, so pricing matters more than timing. Seven years of countywide timing data is here.
What a Lower Rate Does Not Change
A discount listing is a pricing decision, not a service tier. Every Salt Lake City listing includes professional photography, full MLS syndication to Zillow, Realtor.com, and Redfin, pricing built from comparable sales in your neighborhood or building, showing coordination, open houses, offer negotiation, inspection and appraisal management, and closing coordination.
Buyers never see your listing agreement. It is not in the MLS, not on Zillow, and not disclosed in the transaction. A buyer comparing your home to the others on their list is weighing location, condition, and price — not what you agreed to pay your agent.
FAQ: Selling a Home in Salt Lake City
Methodology & Disclaimer
Data: Wasatch Front Regional MLS Sales Per Month Reports, Salt Lake County, City of Salt Lake City, single-family and condo, October 2025 through September 2026, pulled October 2, 2026. Median sold price is the median of monthly medians; monthly medians are shown rounded. Totals and averages are pooled across months; volume divided by count reconciles with the published monthly averages. Days on market is the median of monthly figures and measures listing to contract. October 2026 is excluded as a partial month; MLS figures revise as late closings report. Cost percentages other than commission are estimates that vary by title company, HOA, closing date, and negotiated terms — your settlement statement governs.
DiscountAgent.com is not a real estate brokerage. It is the marketing website of Aaron Peters, a licensed Utah real estate agent. Services are provided through NetLogix Realty, License #6390407-AB00. Commission rates are negotiable and are not set by law. Utah is a non-disclosure state; dollar figures shown are approximate.
What Would Your Salt Lake City Home Net?
Free market analysis priced from recent sales in your neighborhood or building, plus a line-by-line estimate of your costs and net proceeds. Full-service listing at 1% to 1.5%. Five-Star Rated on Google since 2006.
Related Reading
Salt Lake City Homes for Sale — Neighborhoods and current listings across the city.
Salt Lake City Downtown Condos — Condo buildings and listings downtown.
Salt Lake City Open Houses — This weekend’s open houses in Salt Lake City.
Utah Home Prices — Current median prices across Utah.
The Best Time to Sell a House in Utah — Seven years of days-on-market data by month.
Salt Lake County Market Report 2026 — Countywide medians, sales, and days on market.
Enjoy this blog post? Click here to subscribe for updates
Leave A Comment